Agency Utilization Rate: Benchmarks, Formula and Examples
 By Suraj Rao11 min read
What You'll Learn
- Utilization rate is billable hours divided by available hours, and available hours should exclude holidays and leave but still include internal time.
- Targets differ by role: designers and developers should sit well above account managers and owners, so a blended team rate always looks lower than the individual targets.
- Published benchmarks disagree, even on the same vendor's site, so treat them as ranges and set targets from your own tracked history.

Your agency utilization rate is the share of your team's available working time that goes on billable client work. It's the number agency owners compare most often, and the one most often calculated in different ways.
Two agencies can both say "we run at 70%" and mean different things: one counts holidays as available time, the other doesn't. Before you compare rates, check what's in the formula.
For the basics of billable and non-billable time, start with our complete guide to billable hours. This post goes further for agencies: what to put in available hours, billable utilization vs total utilization vs realization rate, a worked team example, what published benchmarks say and where they disagree, why 100% is the wrong target, a step-by-step utilization calculator and how to track it each week and month.
What is agency utilization rate?
Utilization rate measures how much of the time your people could work is spent on work a client pays for. For an agency it drives revenue on hourly and retainer work, shows whether fixed prices cover the time spent, and tells you when to hire (a team running hot for months) or sell harder (a team running cold).
The utilization rate formula
Utilization rate = billable hours ÷ available hours × 100The hard part is agreeing on available hours. Get this wrong and every comparison after it is off.
What counts as available hours
Start from contracted hours. Take off time a person isn't expected to work at all, and keep in time they work but can't bill.
| Take it out of available hours | Leave it in available hours |
|---|---|
| Paid vacation and annual leave | Internal meetings |
| Public holidays | Sales, pitches and proposals |
| Sick days and other leave | Training and learning |
| Agreed part-time days off | Admin, invoicing and timesheets |
Internal time is working time spent on non-billable work, so it stays in. Leave doesn't.
Here's a full-time year with example numbers. Swap in your own leave policy.
| Hours | |
|---|---|
| 52 weeks × 40 hours | 2,080 |
| Minus 20 days of annual leave (20 × 8) | −160 |
| Minus 8 public holidays (8 × 8) | −64 |
| Minus 5 days' sick leave allowance (5 × 8) | −40 |
| Available hours | 1,816 |
At 75% utilization, that's 1,362 billable hours a year. Divide the same 1,362 hours by 2,080 and it shows as 65.5%, and you'd be chasing a problem that isn't there.
Some agencies also take out time set aside for sales to get "client-available hours". That's fine if you write the definition down and use it for every person and period.
Billable utilization, total utilization and realization rate
Agencies use three related numbers. They answer different questions.
| Metric | Formula | What it tells you |
|---|---|---|
| Billable utilization | Billable hours ÷ available hours | How much of the week went on work you can charge for |
| Total utilization | All logged work hours ÷ available hours | How busy people are, billable or not |
| Realization rate | Billed value ÷ billable value | How much billable work reached an invoice at full rate |
Billable value is billable hours × your standard rate. Billed value is what you actually invoiced for that work, after write-offs, discounts and hours that never got billed.
Worked example: one designer, one month
A designer has 21 working days this month and takes 3 days of leave: 18 × 8 = 144 available hours. Their timesheet shows 101 billable hours, 30 hours of internal work (a pitch, team meetings, training) and a standard rate of $95 an hour.
Billable utilization: 101 ÷ 144 × 100 = 70.1%.
Total utilization: (101 + 30) ÷ 144 × 100 = 91.0%. They're busy. Not all of it is billable.
Now realization. Of the 101 billable hours, 8 were a fixed-price overrun and written off, 5 were billed at half rate after a complaint and 88 were billed in full.
- Billable value = 101 × $95 = $9,595
- Billed value = (88 × $95) + (5 × $47.50) = $8,360 + $237.50 = $8,597.50
- Realization rate = $8,597.50 ÷ $9,595 × 100 = 89.6%
Multiply the two for the share of available time that became full-rate revenue: 70.1% × 89.6% = 62.8%.
On a fixed fee, billed value is the fee. If a $6,000 project took 72 hours at $95, billable value is $6,840 and realization is 87.7%. If it took 55 hours, realization is $6,000 ÷ $5,225 = 114.8%. Over 100% on fixed-price work means you priced above the time it took.
A worked team example: why targets differ by role
Here's a hypothetical four-person agency over one month. Everyone has 160 available hours.
| Role | Available | Billable | Utilization | Where the rest goes |
|---|---|---|---|---|
| Designer | 160 | 120 | 75% | Internal reviews, training, pitch work |
| Developer | 160 | 128 | 80% | Code reviews, tooling, estimates |
| Account manager | 160 | 72 | 45% | Status reports, planning, upsell talks, coordination |
| Owner | 160 | 32 | 20% | Sales, hiring, finance, strategy |
| Team | 640 | 352 | 55% |
Everyone is doing what their role needs, yet 55% looks poor next to a "70% to 80%" benchmark.
A blended number mixes roles that should sit near the top of the range with roles whose value is mostly non-billable. If the owner pushed their own billable time to 60%, the team rate would rise to 65%, and next quarter's pipeline would be empty.
Set a target per role, then work out the team target from your actual mix of people:
Target team rate = sum of (each person's available hours × role target)
                   ÷ total available hours
With targets of 75%, 80%, 45% and 20%, this team's target is (120 + 128 + 72 + 32) ÷ 640 = 55%. Measured against that, it's exactly on track.
Utilization benchmarks by role and agency type
Most published utilization benchmarks come from time-tracking and project-management vendors, not independent surveys. Use them as ranges, not rules.
| Who | Published range | Source |
|---|---|---|
| Marketing agencies | 70% to 80% | Harvest: what is a good utilization rate for agencies |
| Creative agencies | 60% to 70% | Harvest: what is a good utilization rate for agencies |
| Creative agencies | 70% to 80%, slightly lower for creative roles | Harvest: billable hours calculator for creative agencies |
| Design agencies | 60% to 80%, creative roles around 70% | Harvest: utilization rate calculator for design agencies |
| Agencies overall, by role | 60% to 85% | Everhour: what is a good utilization rate for agencies |
| Individual contributors | About 70% to 85% | Teamwork: utilization rate |
| Managers and directors | About 40% to 60% | Teamwork: utilization rate |
Everhour's guide makes the team example's point: a designer or developer can carry a higher target than an account director, who spends more time on sales and client strategy.
For the wider professional services picture, SPI Research reported that average billable utilization fell to 66.4%, the lowest in its 19 years of benchmarks, according to its 2026 report announcement. Our billable hours guide covers SPI's targets in more detail.
Where the sources disagree
Creative agencies are the clearest case. Harvest's own pages give two answers: one puts creative agencies at 60% to 70% because concept work takes time that doesn't bill, while its creative-agency calculator calls 70% to 80% healthy, with creative roles slightly lower. Its design-agency page sits between them at 60% to 80%.
They rest on different assumptions about who's counted and what's in available hours. So quote the range and the source, not the number you like best, and trust three months of your own tracked time over any vendor page.
Why 100% utilization is a bad target
A 100% target sounds efficient. In practice it breaks things:
- No time for sales. Someone has to write the next proposal.
- No time to learn. A team that never trains falls behind on tools and client expectations.
- No slack. An urgent fix or a sick colleague's work has nowhere to go but overtime.
- Burnout. Months flat out cost you in mistakes, sick days and resignations, and replacing a good designer costs far more than the hours you squeezed out.
- Worse estimates. With no time to review finished projects, the same overruns repeat.
A very high number can also mean people are logging everything as billable. Your realization rate will show it, because clients won't pay for all of it.
How to raise utilization without overworking your team
The goal is more billable hours inside the same working week, not a longer week.
Cut non-billable admin
Look at last month's non-billable hours by category. Templates and invoices built straight from tracked hours give that time back. In Tristiks Grow you can add a client's unbilled hours to an invoice and include several teammates' hours on the same one, so nobody retypes timesheets.
Control scope
Unbilled extras lower realization. Log every request outside the brief and turn it into a change request. Our guide to scope creep has the wording.
Estimate from tracked time
If one type of project always runs 25% over, the problem is the quote, not the team. Compare estimates with actual hours and feed the difference into the next quote. Our guide to project budgets shows how to check this weekly.
Fix pricing and roles before pushing hours
If your billable people are near target, more hours means longer days. A higher rate, or a fixed price that reflects the real hours, raises revenue at the same utilization. Move work senior people do to junior people where you can.
A utilization calculator, step by step
Here's a worked example for a developer over one quarter, with example numbers.
- Count working days. 13 weeks × 5 days = 65 days.
- Subtract leave and public holidays. 6 vacation days and 2 holidays: 65 − 8 = 57 days.
- Convert to available hours. 57 × 8 = 456 hours.
- Add up billable hours from the timesheet. 352 hours.
- Calculate billable utilization. 352 ÷ 456 × 100 = 77.2%.
- Calculate billable value. 352 × $110 standard rate = $38,720.
- Add up what was invoiced for that work. $35,640.
- Calculate realization. $35,640 ÷ $38,720 × 100 = 92.0%.
- Compare with the role target. At 80%: 456 × 0.80 = 364.8 hours. The gap is 12.8 hours, about one hour a week.
- Ask why before changing anything: untracked time, a quiet client or extra internal work.
Copy this template into a spreadsheet or a note:
Person / role:          ________________   Period: ____ to ____
Available hours:        (working days − leave and holidays) × hours per day = ____
Billable hours:         ____
Billable utilization:   billable ÷ available × 100 = ____%
Billable value:         billable hours × standard rate = $____
Amount invoiced:        $____
Realization rate:       invoiced ÷ billable value × 100 = ____%
Target billable hours:  available × role target = ____
Gap and reason:         ____ hours, because ________________
How to track utilization weekly and monthly
Timesheets filled in from memory on Friday lose short billable tasks, so the rate comes out low for the wrong reason.
Weekly, per person: check that all time is tracked against a client, project and task and marked billable or not. Compare billable hours with the role target on a rolling four-week average, so one quiet week doesn't count as a trend. Talk about reasons, not the number.
Monthly, for the business: compare the team rate with the target from your role mix, check realization per client, look at non-billable hours by category and flag anyone above target for more than a month.
Doing it in Tristiks Grow
Your team starts the timer on a client, project and task in the desktop app or the browser, or adds time by hand afterwards, and marks each entry billable or not. As the account owner, you see the whole team and can open anyone's day. Teammates see only their own.
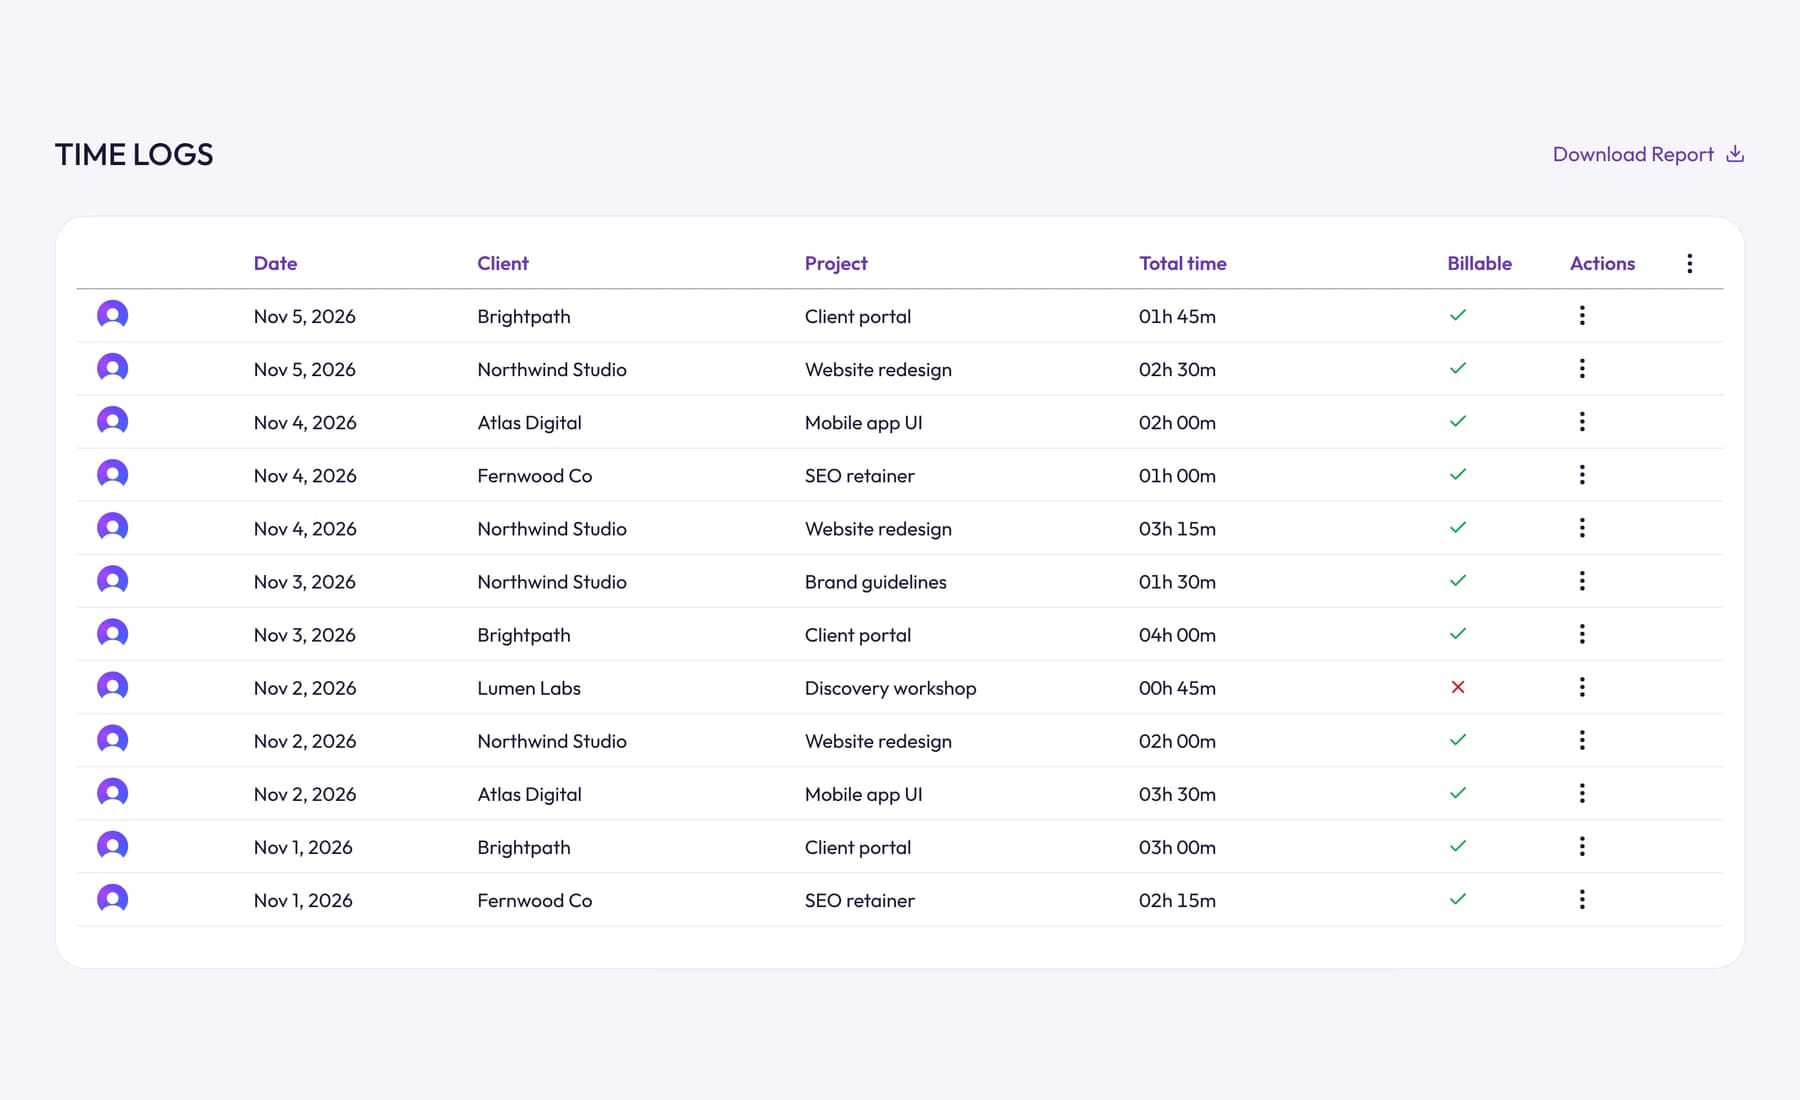
You can see tracked hours by day, week, month or year, filtered to any client or project. For a utilization sheet, download the time log as a CSV: each entry comes with the teammate, date, client, project, task, length, billable status and the invoice it went on. A pivot table by person and billable status gives you the billable hours for the calculator above. A PDF time report also shows what the hours earned at each client's hourly rate.
Each project shows its tracked time next to its estimate, which is where realization problems usually show up first. See how it fits a team on time tracking for agencies.
Our guide to employee productivity tracking covers what to measure and what to leave alone, and how to manage a remote team covers setting up time tracking fairly when people work apart.
Frequently asked questions
What is a good utilization rate for an agency?
It depends on role and type of work. Published ranges for agency delivery roles mostly fall between 60% and 85%, with creative work often placed lower. Account managers and owners should be well below that, so set targets per role and work out the team target from your mix.
Should holidays count as available hours?
No. Most agencies take vacation, public holidays and sick leave out of available hours, because nobody is expected to work then. Keep meetings, training and sales in, because those are working hours spent on non-billable work.
What's the difference between utilization and realization?
Utilization measures how much available time went on billable work. Realization measures how much of that work was billed at full rate. High utilization with low realization means you're doing the work but not getting paid for all of it.
Should the agency owner be included in utilization?
Yes, with their own low target. Leaving the owner out makes the team rate look better, but it hides how much of their week goes on delivery instead of sales and running the business.
Wrap up
Agency utilization rate is easy to calculate and easy to misread. Define available hours once, set a target for each role and measure realization alongside it, so you know whether busy hours are turning into paid ones.
To get the tracked hours behind the numbers, try Tristiks Grow time tracking for agencies free for 14 days.
Category: Time Tracking, Client Management
Suraj Rao
Suraj Rao is the founder of Tristiks, the team behind Tristiks Grow and its desktop time tracker OneTrack. He writes about time tracking, client work and getting paid, and about DevOps, cloud and AI from years of building software.